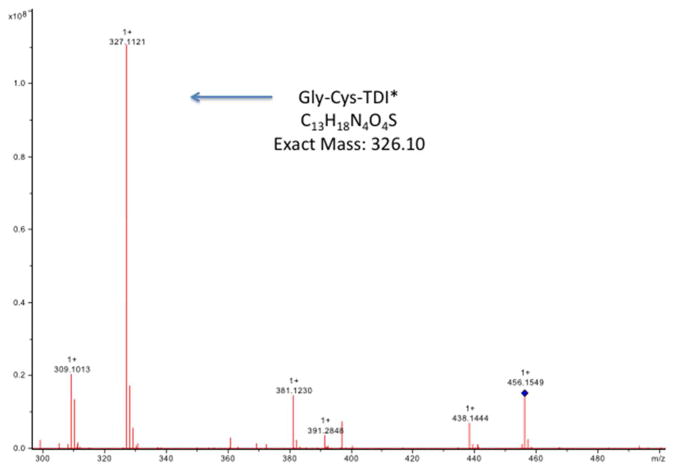
Figure 4.
Tandem mass spectrometry analysis of peak A from HPLC purified GSH-TDI reaction products. A sample of peak A from the HPLC fractionation of GSH exposed to TDI vapor was analyzed by MS/MS (X-axis = m/z), focusing on the major m/z 456.2 product. The MS/MS spectrum shows a major fragment with an m/z consistent with the Gly-Cys-TDI* structure shown in Figure 6, suggesting linkage of TDI via the thiol of Cys, rather than the glutamate amino acid of GSH. Identical results were obtained with peak B from the HPLC fractionation shown in Fig. 2.

