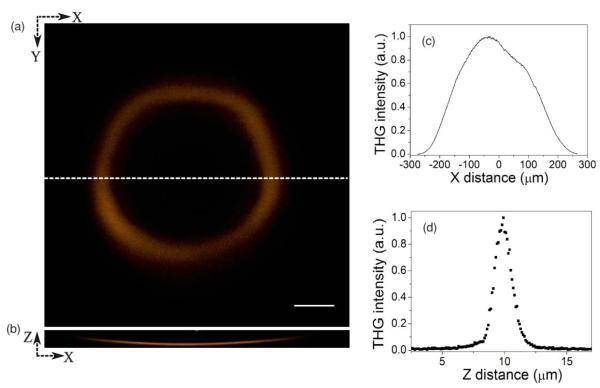
Fig. 2.
(a) THG signal from a cover slip–air interface placed perpendicular to the laser beam direction and (b) the corresponding XZ view demonstrating the curvature of field of the microscope. (c) THG signal variation across the entire field of view. (d) The axial THG intensity profile along the cover glass–air interface of a region near the center of the field of view has FWHM of 1.34 μm. Scale bar in (a) is 100 μm.

