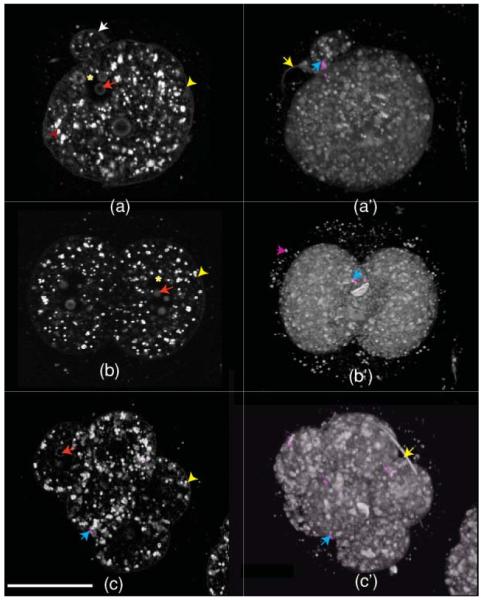
Fig. 3.
HG images of 0.5-(single cell), 1.5-(two cells), and 2.5-(morula) day-old mouse embryos. (a–c) are optical sections and (a c) are the corresponding 3-D opacity rendering (intensity in log scale). The SHG signal [blue arrows: pointing top right in (a′), middle part in (b′) and in the lower left part of (c) and (c′)] is from central spindles, whereas THG is predominantly from lipid droplets [red arrow head in the left side of (a)]. Features like the plasma membrane (yellow arrow head in the right side of (a-c)), nucleus [asterisk in (a)], nucleoli [red arrow pointing left in (a–c), sperm tail (yellow arrow on the top left part of (a′) and upper right part of (c′)], and second polar body [white arrow on the upper middle part of (a)] are also demarcated by THG microscopy. The scale bar is 30 μm. (Color online only.)

