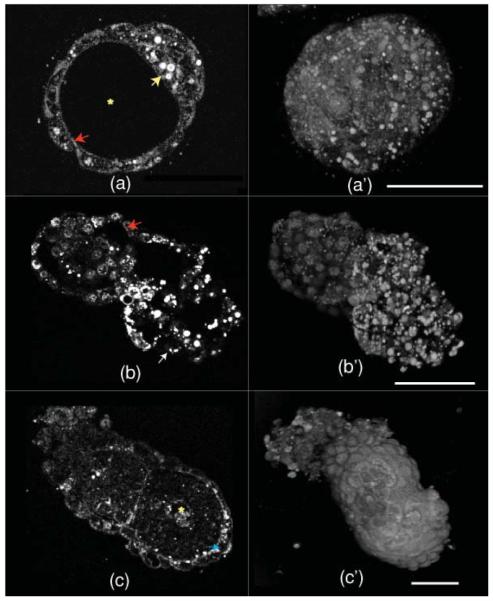
Fig. 4.
HG images of 3.5-(blastocyst), 4.5-(peri-implantation), and 5.5-(postimplantation) day-old mouse embryos. (a–c) are optical sections and (a–c) are the corresponding 3D opacity rendering. In (a), the yellow arrow to the right marks the inner cell mass, the red arrow to the left the trophectoderm, and the asterisk the blastocoel cavity (see Video 1 for full 360-degree rotation of a blastocyst). In (b), the red arrow (top middle part) marks a cell nucleus and the white arrow (at the bottom) marks a lipid droplet. In (c), the blue arrow at the right marks HG signal from the basolateral aspect of the visceral endoderm and the asterisk marks the proamniotic cavity (see Video 2 for full 360-degree rotation of a 5.5-day-old embryo). The scale bar is 50 μm. (Color online only.)

