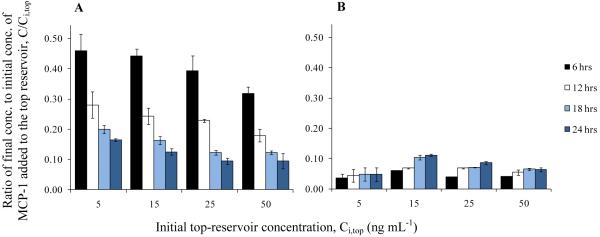
FIGURE 3.
Concentration of MCP-1 in the top and the bottom reservoirs of the 3D vascular tissue model without cells. Complete medium with different concentrations of MCP-1 was added to the top reservoir, and the tissue model was incubated at standard conditions to allow for the diffusion of MCP-1 to the bottom reservoir. Samples were collected from the tissue model during the incubation period. Fig. 3A shows the ratio of the concentration of MCP-1 in the top reservoir, to the initial concentration of MCP-1 added to the top reservoir, Ci,top. Fig. 3B shows the ratio of the concentration of MCP-1 in the bottom reservoir, to the initial concentration of MCP-1 added to the top reservoir, Ci,top. Values are presented as mean ± SD.

