
Figure 1.
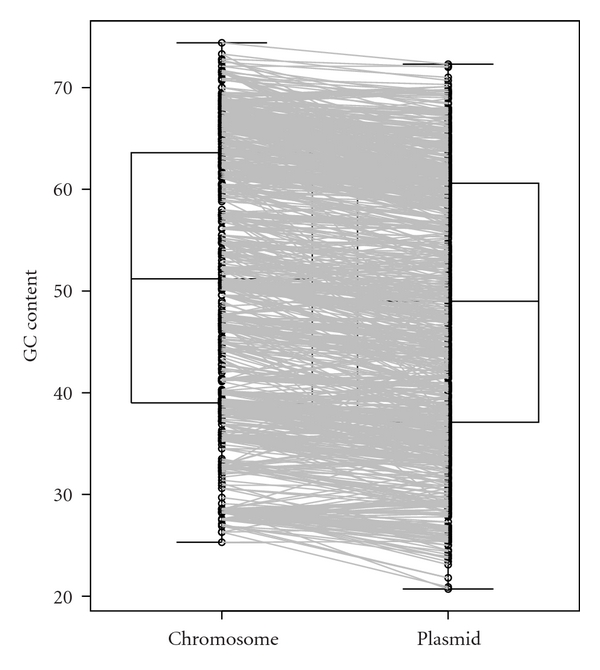
Boxplot of GC contents in bacterial plasmids and host chromosomes. Circles indicate the GC content (%) of each plasmid or chromosome, and lines link each plasmid to its host chromosome. The data set was shown in Supplementary Table S1 available online at doi:10.1155/2012/342482.