
Figure 5.
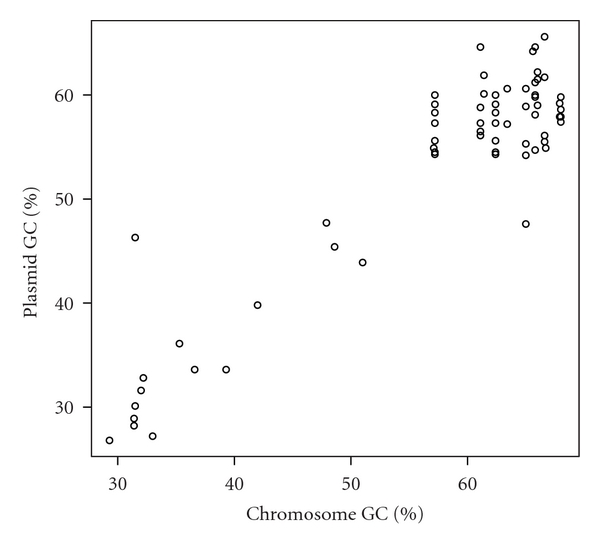
Scatter plot of GC contents of archaeal plasmids and host chromosomes. The Pearson's correlation coefficient is 0.917. The data set was shown in Supplementary Table S2.
Official websites use .gov
A
.gov website belongs to an official
government organization in the United States.
Secure .gov websites use HTTPS
A lock (
) or https:// means you've safely
connected to the .gov website. Share sensitive
information only on official, secure websites.
Scatter plot of GC contents of archaeal plasmids and host chromosomes. The Pearson's correlation coefficient is 0.917. The data set was shown in Supplementary Table S2.