
Figure 6.
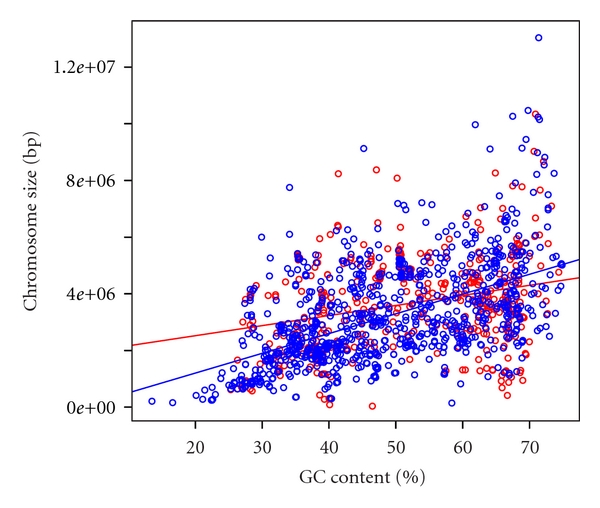
Scatter plot of GC contents and chromosome sizes in bacteria. Red and blue circles indicate chromosomes with and without plasmids, respectively. Red and blue lines indicate the regression lines. The data set was shown in Supplementary Table S3.