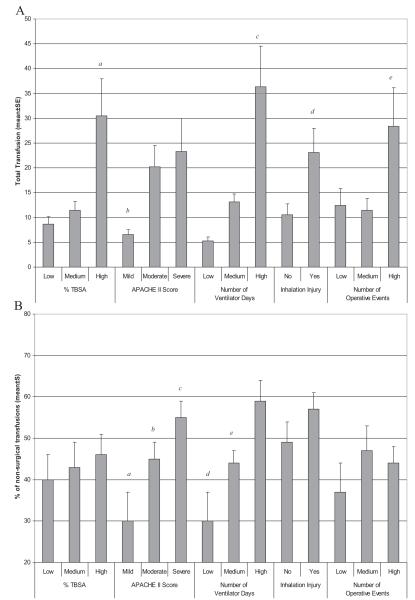
Figure 2.
Correlation between transfusion and clinical variables (A) Total transfusions administered to patients based on clinical variables. p<0.05 for a=% TBSA high v. low and high v. medium, b=APACHE II score mild v. moderate, and mild v. severe, c=number of ventilator days low v. medium, low v. high and medium v. high, d=inhalation injury no v. yes, e=number of operative events low v. high and medium v. high. (B) Percentage of non-surgical transfusions administered to patients based on clinical variables. p<0.05 for a= APACHE II score mild v. moderate; b=mild v. severe, c= moderate v. severe, d=number of ventilator days low v. high, e=medium v. high.

