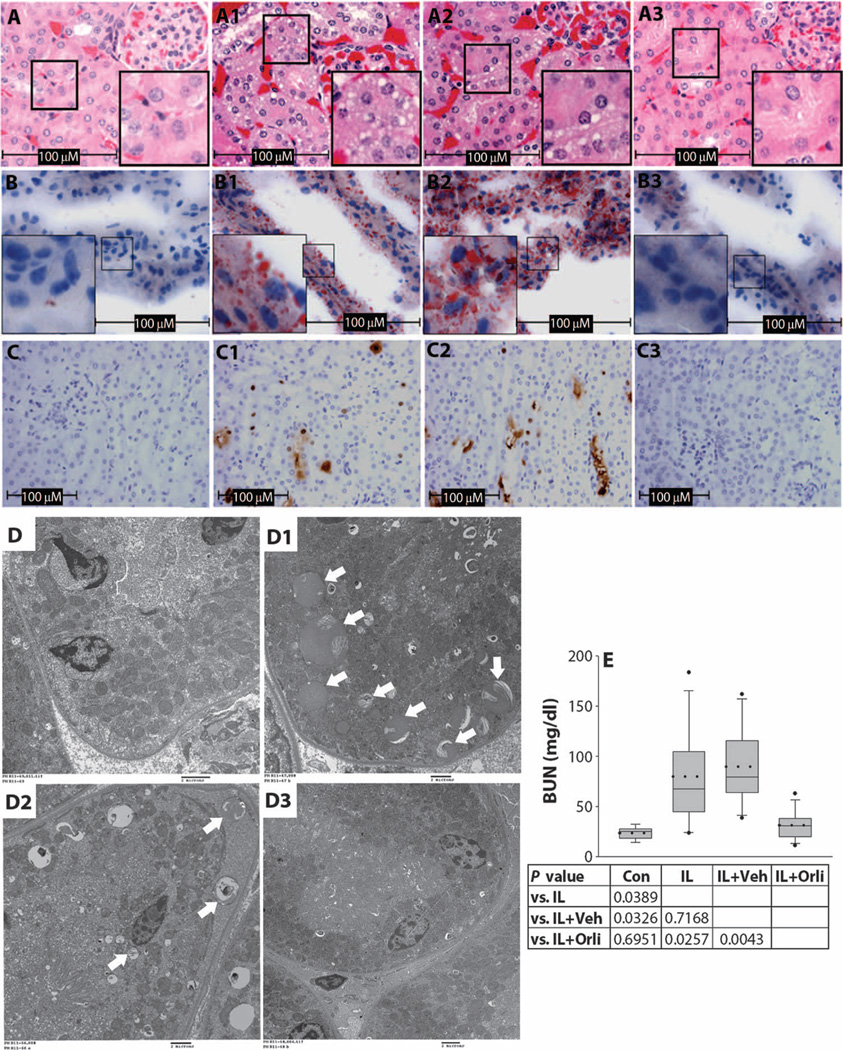
Fig. 7.
Renal tubular lipotoxicity and renal failure are reduced by inhibiting lipolysis. (A to C) Mouse kidney sections stained with (A) H&E, (B) oil red O, and (C) TUNEL (terminal deoxynucleotidyl transferase–mediated deoxyuridine triphosphate nick end labeling) stain in control (A to C), pancreatitis (A1, B1, and C1), pancreatitis with vehicle (A2, B2, and C2), and pancreatitis with orlistat treatment (A3, B3, and C3) groups. (D) Electron microscopy of renal tubules from control mice (D), mice with pancreatitis (D1), mice with pancreatitis + vehicle (D2), and mice with pancreatitis + orlistat (D3) showing lipid vacuoles, some of which have dense deposits of calcification (arrows) and mitochondrial swelling. Scale bar, 2 µm. (E) Serum BUN in controls animals (Con) and animals with pancreatitis (IL), pancreatitis with vehicle (IL + Veh), and orlistat treatment (IL + Orli). Dotted lines depict means, and the whiskers indicate the 5th and 95th percentile, with the dots above and below plots indicating values outside this range. P values are shown below.

