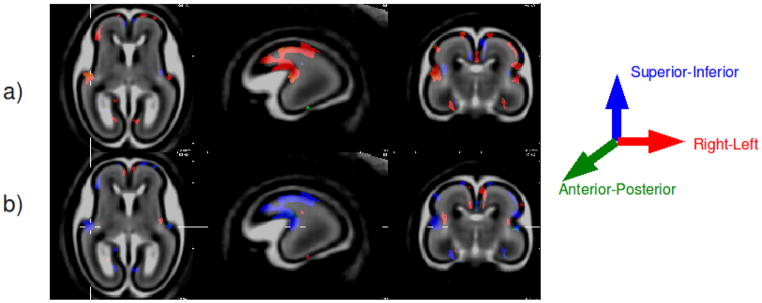
Fig. 3.
Growth rate maps showing regions exhibiting significant change in growth direction with age. Row (a): Regions showing accelerated growth the associated anatomical direction. Row (b): Regions showing decelerated growth and the associated anatomical direction. Each reference anatomical direction is indicated by one color: red = left-right (R-L); green = anterior-posterior (A-P); blue = superior-inferior (S-I). The panels from left to right indicate axial, sagittal and coronal views of the brain.

