
Figure 1.
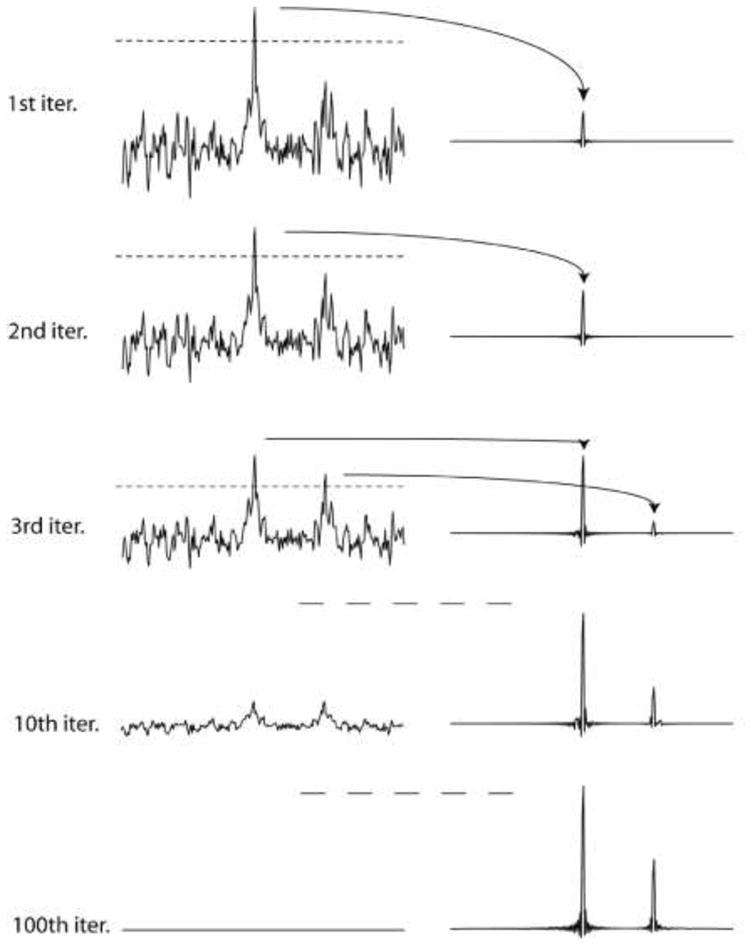
Illustration of the IST procedure. A synthetic time domain signal containing a large and a small resonance is sampled with a non-uniform Poisson-Gap sampling schedule (32 of 128 time-domain data points; 25% density). The line width was chosen so that 128 points correspond to T2. Time domain data were doubled with zero filling, and no apodization was applied prior to FFT, which is manifested in the sinc wiggles at the bases of the resonances. The top parts of the largest signals above a threshold are removed and stored in another file. The truncated spectrum is converted into a second-generation time domain signal by FFT-1, the points where the sampling schedule had zeros initially are set to zero again after the inverse Fourier transform, and the procedure is iterated. As all PSF-related artifacts caused by NUS come from the missing data points the final spectrum contains essentially no such artifacts.