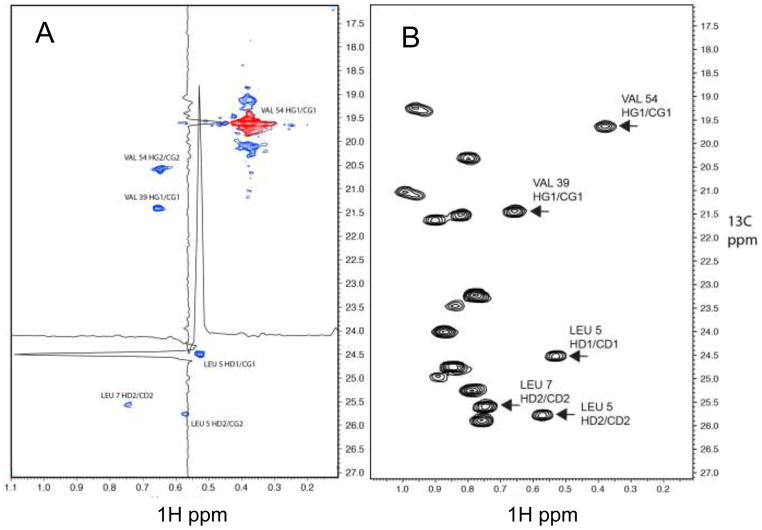
Figure 6.
(A) Representative plane from an IST reconstruction of a NUS (0.8 % sparsity) high-resolution 4D HC-NOESY-CH experiment recorded with a 0.9 mM sample of the B1 domain of protein G (GB1). The indirect 1H and 13C dimensions frequency labeled before the NOE transfer are shown. (B) 1H-13C HSQC for the same spectral region as a reference. The domain was 1H/13C labeled at the methyl groups of ILV residues with 2H/12C everywhere else. In total, 10,906 of the 1,350,000 indirect data points (complex) (0.8 %) were measured with a Poisson-Gap sampling schedule generated by the program used in the GUI of Fig. 3. The spectrum was recorded on a Bruker Avance 500 spectrometer. The indirect proton dimension was recorded with 500.1 Hz spectral width and a maximum of 60 complex points; both indirect carbon dimensions were recorded with 1257.6 Hz spectral widths and a maximum of 150 complex points. The entire spectrum was reconstructed with the IST program within around 4 hrs on a 128 cpu farm. The diagonal peak of the V54 HG1/CG1 methyl group is colored red. Five NOESY cross peaks are visible in the plane and are labeled with the assignments. The methyl group of V54 HG2/CG2 was folded in the indirect 1H dimension. Proton and carbon cross section through the NOE cross peak of L5 HD1/CD1 are depicted to demonstrate the signal to noise ratio and the narrow line shape.

