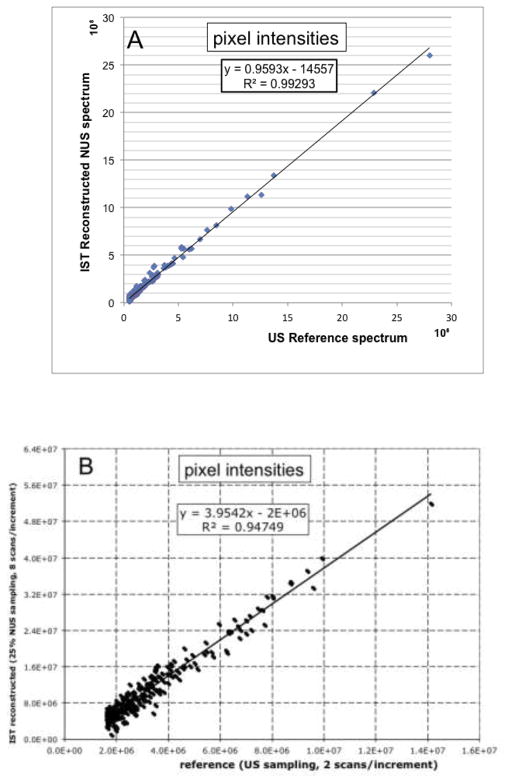
Fig. 7.
Fidelity of peak heights in IST reconstructions. (A) Two 3D 15N-dispersed NOESY spectra of human translation initiation factor eIF4E were recorded uniformly with 128 × 50 indirect 1H × 15N time domain points, and non-uniformly with 32% of the indirect dimensions, both with 8 scans per increment. The NUS spectrum was IST reconstructed, and the heights of peaks are compared for a representative 1H-1H cross plane at the 15N frequency of 126.6 ppm. Values of pixels above noise level between 7 and 10 ppm in the direct dimension are compared. (B) Correlation of peak intensities (pixel values) of uniformly sampled 13C-detected 2D CaN experiments with IST reconstructed NUS data (25% sparsity). The same spectra were analyzed but processed with the FM reconstruction (Hyberts et al. 2010).

