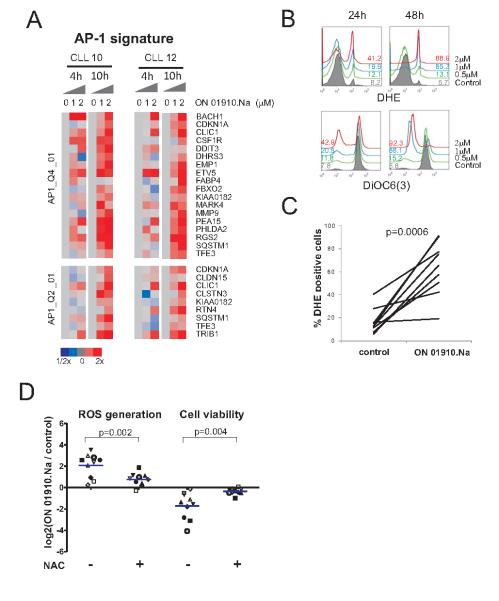
Figure 3. ON 01910.Na induces ROS and activates a stress response mediated by AP-1.
A, purified CLL cells (CD19+ selection) from patients CLL10 and CLL12 treated without and with 1 and 2 μM ON 01910.Na for 4 and 10 hours were analyzed on Affymetrix arrays. The leading edge genes of AP-1 gene signatures (FDR <0.2, Supplementary Table 1) are shown in a heat map representation scaled as indicated. B, ON 1910.Na induced generation of ROS and loss of ΔΨm measured by flow cytometry using DHE and DiOC6 are shown for a representative patient. The percent of DHE positive and DiOC6 low cells is indicated. C, CLL cells from 9 patients were treated with 2 μM ON 01910.Na for 48 hours and ROS generation was measured using DHE staining. The percentage of DHE positive cells at 48 hours is given for ON 01910.Na and control (DMSO treated) cells. D, cells from 10 CLL patients were treated with 1 μM ON 01910.Na for 48 hours in the presence or absence of 25 mM N-acetylcysteine (NAC). ROS generation and cell viability was measured as in B. The log2 of the ratio between treated and untreated cells is depicted.

