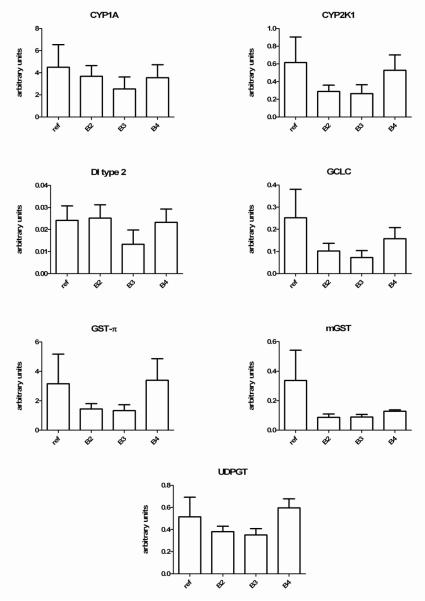
Figure 2.
Comparative hepatic gene expression of 7 genes measured in the livers of Chinook salmon caged for 9 days in a polluted waterway. All data for the individual genes was normalized to the expression of 18s RNA and then multiplied by 1000 to provide the RNA expression units on the y-axis. As discussed in the methods, control fish (ref) were maintained in cages at the fish hatchery and were not fed. All data represent the mean ± SEM of n=5 individuals. There were no site related differences in mRNA expression at p<0.05. Individual p values for reference fish vs site B3 animals are provided in table 5.

