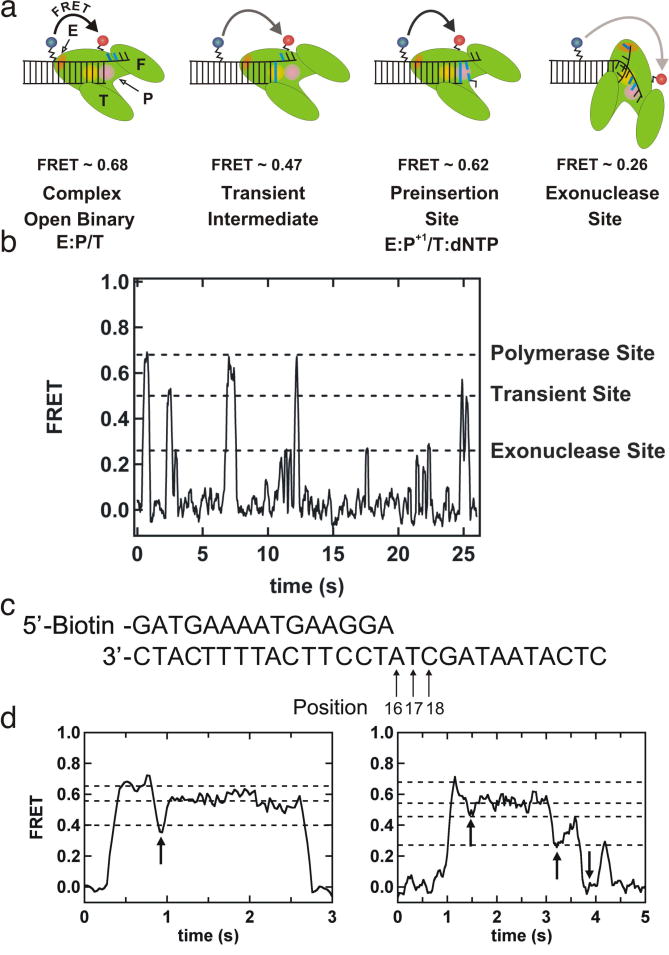
Fig. 7.
Single molecule study of single nucleotide incorporation by a DNA polymerase. (a) Schematic representation of DNA polymerase dynamics showing four different steps. The corresponding FRET values are indicated. F- fingers, P- palm T- thumb, and E- exonuclease (b) A FRET time trace illustrating the different states of the polymerase-bound primer-template complex. The polymerase, transient and exonuclease sites are marked according to their FRET values. (c) A 15-mer-primer template duplex showing the positions of the three products with arrows. (d) FRET trajectory showing the single nucleotide (dTTP) incorporation in the left and three-nucleotide incorporation (dTTP, dATP and dGTP) in the right. Arrows indicate the times at which a nucleotide is being incorporated. This figure is reprinted from (3) with permission.

