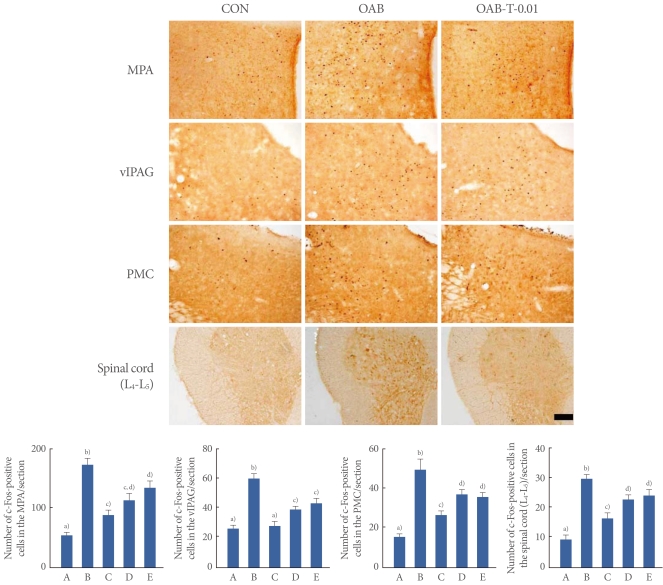
Fig. 2.
Effect of tamsulosin on c-Fos expressions in the neuronal voiding centers (medial preoptic nucleus [MPA], ventrolateral periaqueductal gray [vlPAG], pontine micturition center [PMC], spinal cord [L4-L5] regions) after the induction of overactive bladder (OAB). Upper: Photomicrographs of c-Fos-positive cells in the neuronal voiding centers. The sections were stained for c-Fos immunoreactivity (brown). The scale bar represents 200 µm. Control group (CON), OAB-induced group (OAB), OAB-induced and 0.01 mg/kg tamsulosin-treated group (OAB-T-0.01). Lower: Number of c-Fos-positive cells in each group. (A) Control group, (B) OAB-induced group, (C) OAB-induced and 0.01 mg/kg tamsulosin-treated group, (D) OAB-induced and 0.1 mg/kg tamsulosin-treated group, (E) OAB-induced and 1 mg/kg tamsulosin-treated group. a-d)Statistically significant differences (P<0.05) after Duncan post-hoc test. For example, groups marked with different letters differ statistically.

