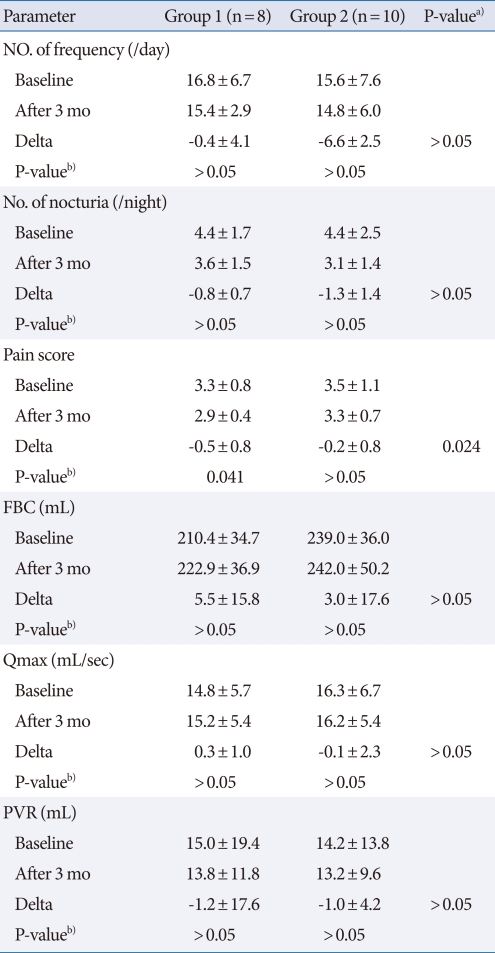
Table 2.
Changes from before treatment to the 3 months follow-up after treatment in the two groups
Values are presented as mean±standard deviation.
FBC, functional bladder capacity; Qmax, maximal urine flow rate; PVR, post-void residual urine volume.
a)P-value by Mann-Whitney U test. b)P-value was analyzed by Wilcoxon signed rank test.

