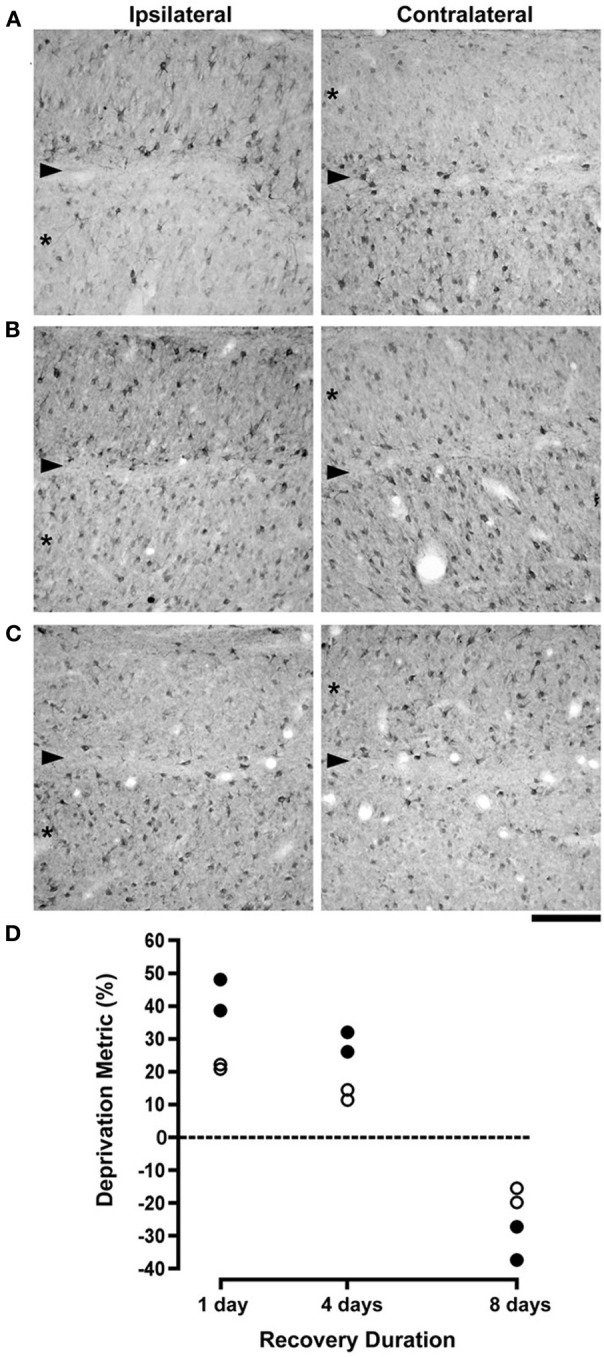
Figure 1.

The effect of different durations of RO on NF-H labeling and on neuron size in the A laminae of the dLGN. Photomicrographs in (A–C) show NF-H labeling in the left and right dLGN (respectively, ipsilateral and contralateral to the deprived eye) where the originally deprived layer in each image is indicated by an asterisk, and the boundary between A layers is identified with an arrowhead. The effect of a preceding week-long period of monocular deprivation was still clearly evident in the originally deprived layers of the dLGN after RO for 1 day (A). Following 4 days of RO there was a recovery of NF-H labeling in originally deprived layers, but the originally non-deprived layers continued to show normal-looking NF-H labeling (B). By 8 days of RO there was a complete reversal of the deprivation effect so that originally deprived layers showed normal levels of NF-H labeling while labeling in the originally non-deprived layers was substantially reduced (C). Assessment of the recovery of neurofilament-positive cell density and neuron size in the dLGN was assessed with a deprivation metric (see Methods) that revealed a marked reversal of both NF-H labeling and neuron size. The size of neurons in originally deprived layers, which were smaller than originally non-deprived neurons at 1 day of RO, were larger than originally non-deprived neurons by almost the same amount following 8 days of RO (open circles in D). Likewise, originally deprived layers of the dLGN that exhibited comparatively fewer NF-H immunopositive neurons after 1 day of RO, contained considerably more NF-H labeled neurons following 8 days of RO (solid circles in D). Therefore, RO for 8 days fully reversed the effect of monocular deprivation on neuron size and NF-H labeling. The dashed line in (D) represents the point at which no difference exists between measurements from right and left eye layers. Scale bar = 100 μm.
