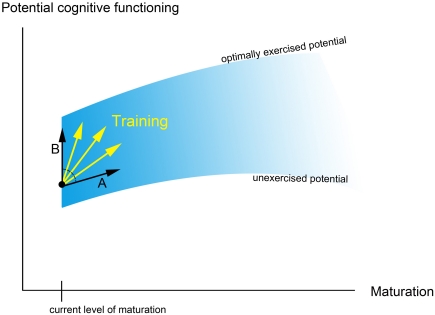
Figure 1.
This figure shows a simplified, metaphorical description of how training might influence developmental trajectories [based on Denney (1984); see also Hertzog et al. (2009)]. The blue curve shows the potential of cognitive functioning, which increases with age due to maturational changes and common environmental experience. In addition, optimal environmental input and training determine whether the “optimally exercised potential” (i.e., the upper limit of cognitive functioning at a certain age; Denney, 1984) can be reached. Arrow A shows how training may improve cognitive functioning by speeding-up development; arrow B shows how training might improve functioning in a way that deviates from the typical developmental trajectory.

