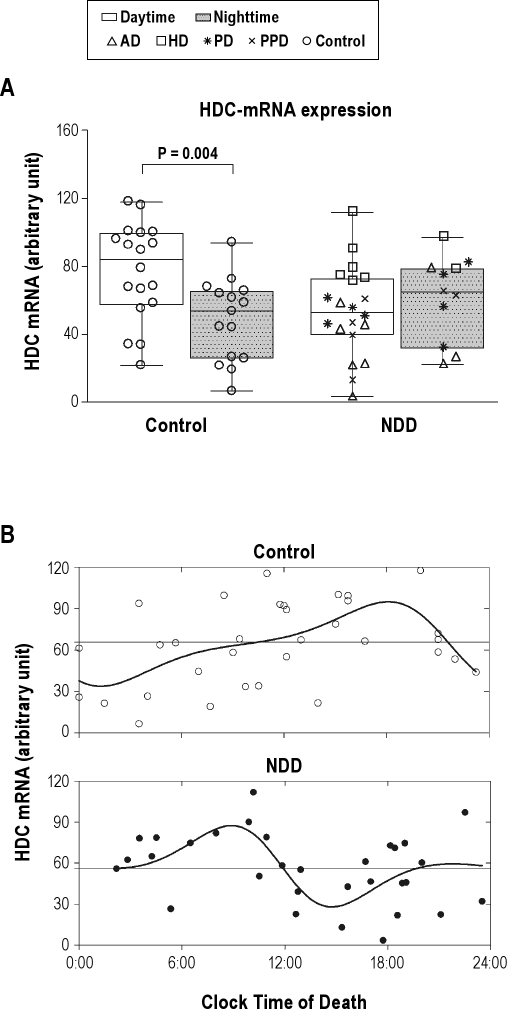
Figure 1.
(A) Box plots show the median, 25th-75th percentiles and the total range of radioactivity in arbitrary units. The total amount of radioactivity of histidine decarboxylase (HDC)-mRNA expression is given for control subjects between daytime (08:01-20:00; n = 18) and nighttime (20:01-08:00; n = 15) on the left side, and for neurodegenerative diseases group (NDD, daytime n = 20, nighttime n = 11) on the right side. Note that there is a significant difference (P = 0.004) between daytime and nighttime in control subjects, but not in NDD (P = 0.410). (B) Raw data of HDC-mRNA expression plotted along the clock time of death. The nonlinear periodic functions describe the circadian cycles. The model in controls (open dots) reach an estimated maximum at the end of the afternoon (Tmax = 18:09) and a minimum shortly after midnight (Tmin = 01:09). The model in NDD group (block dots) reaches an estimated maximum in the morning (Tmax = 08:56) and a minimum in the afternoon (Tmin = 14:43).The horizontal lines indicate the 24-h mean of HDC-mRNA expression in controls and NDD group, respectively.

