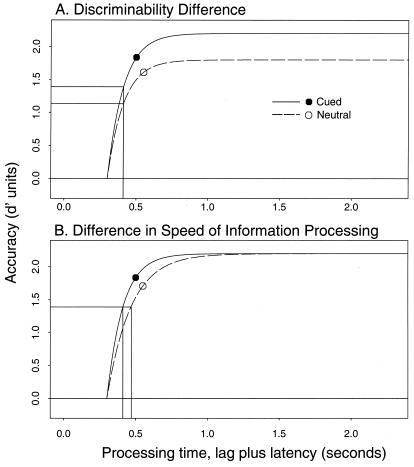
Figure 2.
Hypothetical SAT functions. Illustrative SAT functions, plotted in d′
units ( of the standard normal deviate of the
probability of correctly judging the target's orientation) versus
processing time (time of the response cue plus observer's latency to
respond) in seconds. (A) Expected pattern if cueing
increases target discriminability only. The functions differ in
asymptotic accuracy, but are associated with the same intercept (point
when accuracy departs from chance) and proportional rate of information
processing. (B) One expected pattern if cueing target
location alters the rate of information processing only. The functions
display disproportional dynamics; they reach a given proportion of
their asymptotes at different times. Circles show hypothetical RT
results plotted in SAT coordinates (abscissa = mean RT;
ordinate = the accuracy level associated with mean RT),
illustrating that RT differences can reflect differences in
discriminability (A) or the speed of information
processing (B). Approximately the same difference in
mean RT and accuracy is consistent with either differences in SAT
asymptote (A) or SAT dynamics (B). The
position of the RT points on the corresponding SAT functions are
determined by the decision criteria that an observer uses to balance
speed and accuracy. Here, the hypothetical RT data are shown slightly
higher than the 1 − 1/e (63%) point—a position
often found in direct comparisons of RT and SAT
procedures—illustrating that, in conventional RT tasks, observers
often trade modest decrements in accuracy for substantial gains in
speed (27–30).

