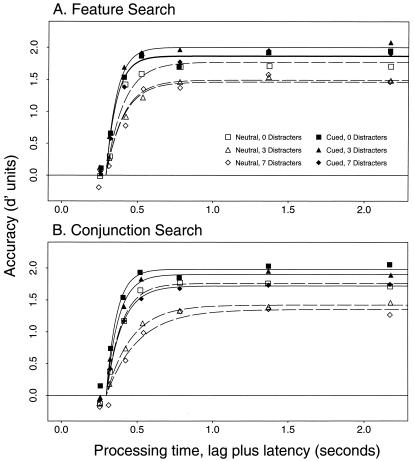
Figure 3.
Results. Average (over observers) discrimination accuracy (in d′units) as a function of processing time in feature (A) and conjunction (B) searches. Smooth functions show the best-fitting exponential model (Eq. 1) for the cued (solid lines) and neutral (dashed lines) conditions, based on fits of nested models that systematically varied the three parameters of Eq. 1. Quality of fit was determined by the value of an adjusted-R2 statistic (26–30), the proportion of variance accounted for adjusted by the number of free parameters, and by the consistency of parameter estimates across observers. The simplest best-fitting model for feature searches allocated a separate asymptotic parameter (λ) to each of the six conditions, one rate (β) parameter to the cued conditions and another to the neutral conditions, and a single intercept (δ) parameter (adjusted-R2 = 0.979 for the average data, ranging from 0.897 to 0.944 across observers). The best-fitting exponential model for conjunction searches allocated a separate asymptotic (λ) and rate (β) parameter to each of the six conditions, and a single intercept (δ) parameter (adjusted-R2 = 0.984 for the average data, ranging from 0.889 to 0.961 across observers). Table 1 shows average parameter values.

