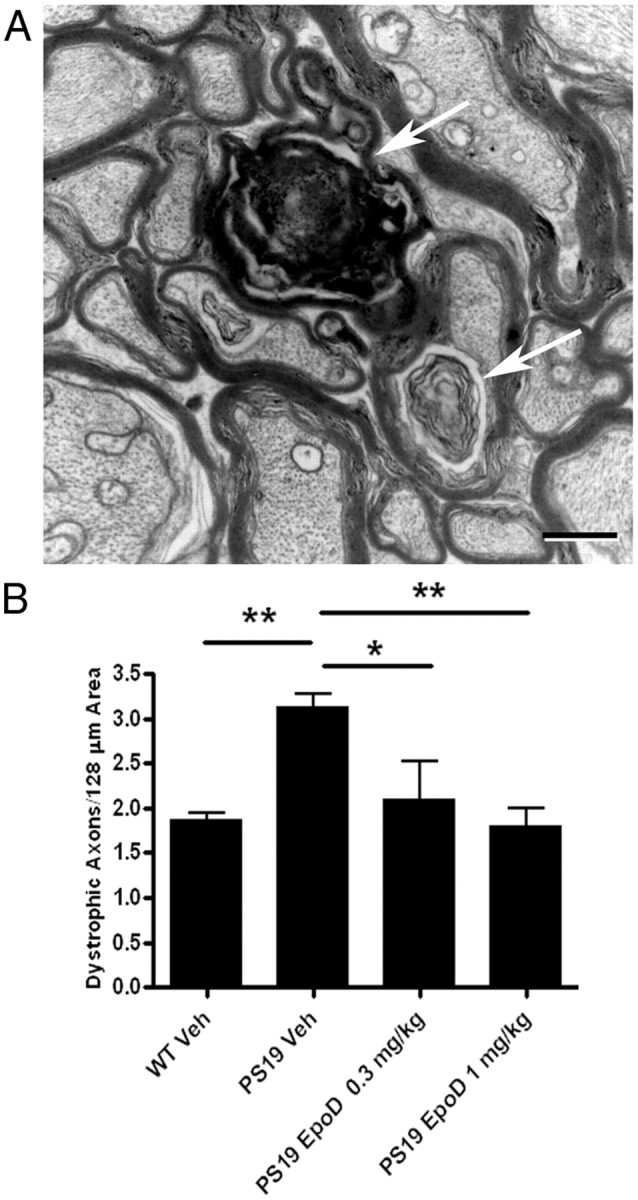
Figure 1.

Comparison of axonal dystrophy in vehicle- or EpoD-treated 12-month-old PS19 and WT mice. The number of dystrophic axons per unit area of ON was determined for WT or PS19 mice that had received administration of either vehicle or EpoD from 9 to 12 months of age. A, A representative micrograph showing examples of dystrophic axons (arrows). Scale bar, 0.5 μm. B, Quantification of the number of dystrophic axons per area for the various treatment groups. Error bars indicate SEM; *p < 0.05, **p < 0.01, as determined by one-way ANOVA and Tukey's multiple-comparison test, with n = 8–10 mice evaluated/group. Veh, Vehicle.
