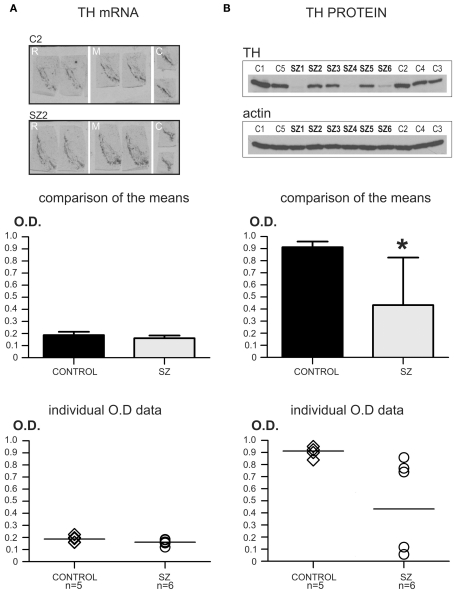
Figure 1.
Pilot study: TH mRNA and protein levels in schizophrenia and control cases. *P < 0.05. (A) TH mRNA levels in control (n = 5) and schizophrenia (n = 6) cases. The top panel shows representative images of TH mRNA in situ hybridization in rostral (R), medial (M), and caudal (C) sections of the SN/VTA of a control case (C2), and a schizophrenia case (SZ2). Comparison of the mean values for TH mRNA OD is shown in the bar graph (middle panel). Mean optical density (OD) values for TH mRNA levels in control and schizophrenia (SZ) cases did not differ significantly (P = 0.12; OD mean ± SD: control = 0.187 ± 0.027, schizophrenia = 0.161 ± 0.023). The bottom panel shows a scatter plot for the individual TH mRNA OD values. The horizontal bar in the scatter plot indicates the mean OD value for each group. Note the dense clustering of all the OD values for both groups. (B) TH protein levels in the same control and schizophrenia cases used for the mRNA study. The top panel shows representative images of the same western-blot membrane, first blotted for TH protein, and then reblotted for actin. This membrane contained all the control (C1–C5) and schizophrenia (SZ1–SZ6) cases used in this pilot study. Note the conspicuous difference in blot signal among the different samples in the TH western-blot image, while actin expression is uniform among all cases. The comparison of the means for TH protein levels in controls and schizophrenia is shown in the mid panel (bar graph). OD values for TH protein were significantly different (*) between the two groups (P = 0.031; OD mean ± SD: control = 0.912 ± 0.046, schizophrenia = 0.433 ± 0.393). The bottom panel shows a scatter plot for the individual TH protein OD values. The horizontal bar in the scatter plot indicates the mean OD value for each group. Note the dense clustering of the OD values for the control group, while in the schizophrenia group there is a large scattering of the data. However, note that in the lower TH expression cluster, two cases presented the same exact TH OD value and are represented in the scatter plot as a single circle.

