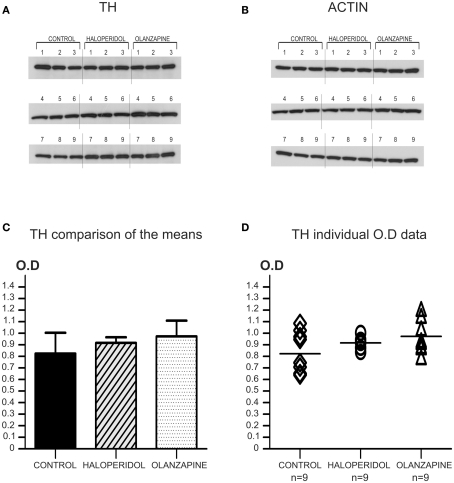
Figure 2.
Animal study: antipsychotic treatment effect on TH protein levels. (A) Western-blot images of TH protein for all the animals of the three treatment groups. All the samples (n = 9 per treatment group) were incubated and developed together on the same film to accurately measure OD. Note the homogeneity of expression of TH for all cases independently of the treatment group. (B) The same western-blot membrane shown in A was reblotted for the detection of actin protein. (C) Comparison of the mean OD for TH protein levels showed no significant differences among the three groups (P = 0.41; OD mean ± SD: control = 0.824 ± 0.181, haloperidol = 0.917 ± 0.049, olanzapine = 0.973 ± 0.136). (D) Scatter plot graph showing the individual TH protein OD values for the three groups. The horizontal bar in the scatter plot indicates the mean OD value for each group.

