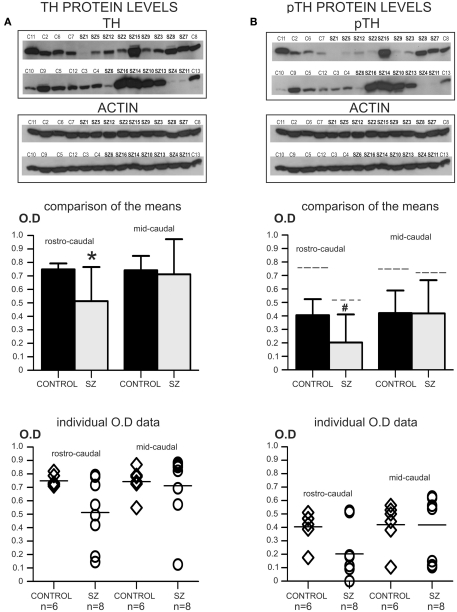
Figure 3.
Second postmortem study: regional distribution of TH and pTH. *P < 0.05; #P > 0.05 < 0.06. (A) The top panel shows images of two western-blots for TH that were developed on the same film, containing all the cases used in this study. Note that rostro-caudal and mid-caudal cases were run together in the same gels. In addition, reblots for actin of the same membranes are shown immediately below. The graph bar (mid panel) shows the comparison of the mean OD values for TH protein in rostro-caudal and mid-caudal samples for controls and schizophrenia. Only the rostro-caudal samples showed significant differences (*) between schizophrenia and control cases (P = 0.036; OD mean ± SD: control rostro-caudal = 0.749 ± 0.044, schizophrenia rostro-caudal = 0.513 ± 0.252; control mid-caudal = 0.743 ± 0.107, schizophrenia mid-caudal = 0.712 ± 0.261). The bottom panel shows a scatter plot for the individual TH OD data. The horizontal bar in the scatter plot indicates the mean OD value for each group. (B) The same membranes in (A) were reblotted for the detection of pTH (top panel). In addition, reblots for actin of the same membranes are shown immediately below. The graph bar in the mid panel shows the comparison of the mean OD values for pTH in rostro-caudal and mid-caudal samples. Even when there were no significant differences in pTH OD values between controls and schizophrenia in rostro-caudal samples, a trend (#) toward significance was observed (P = 0.056; OD mean ± SD: control rostro-caudal = 0.405 ± 0.120, schizophrenia rostro-caudal = 0.203 ± 0.208; control mid-caudal = 0.421 ± 0.168, schizophrenia mid-caudal = 0.419 ± 0.246). For comparison, the dashed line on top of each of the individual bars indicates the mean level of total TH for each group. The ratio of pTH versus total TH for each group was as follows: control rostro-caudal = 54.07%, schizophrenia rostro-caudal = 39.57%; control mid-caudal = 56.66%, schizophrenia mid-caudal = 58.85%. The bottom panel shows a scatter plot for the individual pTH OD data. The horizontal bar in the scatter plot indicates the mean OD value for each group.

