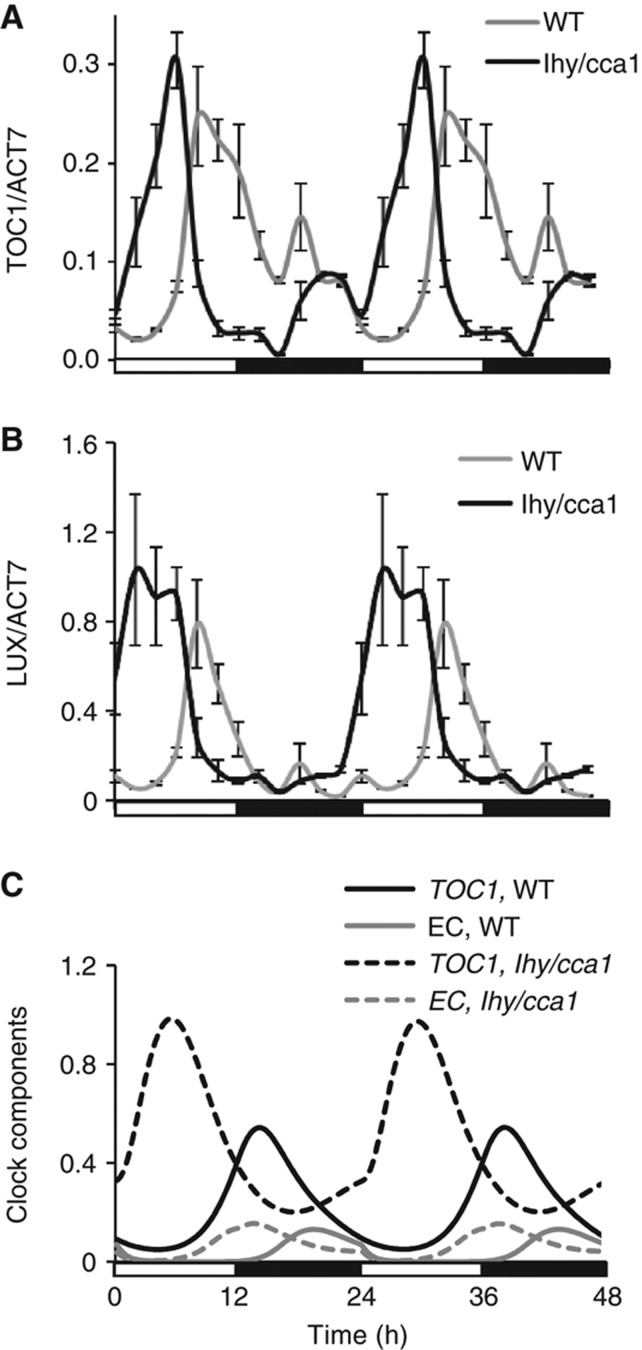
Figure 2.
Regulation of TOC1 and LUX expression in the evening circuit of the clock. The phase advance of TOC1 (A) and LUX (B) expression in the lhy/cca1 double mutant (black line) compared with WT (grey line) was measured by qRT–PCR assays of plants grown under 12L:12D cycles, as described in Supplementary information. (C) Model simulations demonstrate that in both WT and lhy/cca1 plants, the increase in EC (grey lines) coincides with the time of the fall in the expression of the EC's target genes (such as TOC1, black lines). Data are double-plotted to facilitate comparison to simulations. Light conditions are shown by open and filled bars below the figure.

