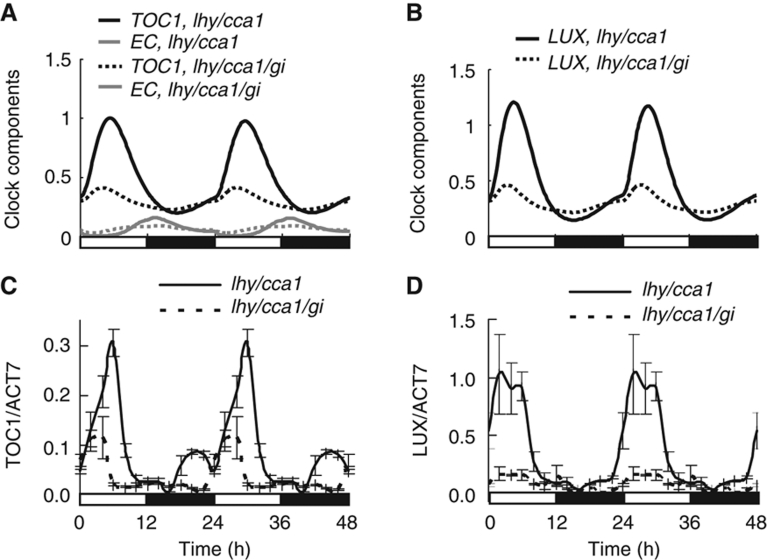
Figure 3.
The role of GI in the regulation of TOC1 expression by the evening loop. Model simulations demonstrate lower peak levels of TOC1 (A) and LUX (B) expression (black lines) in lhy/cca1/gi (dotted lines) compared with lhy/cca1 mutants under 12L:12D cycles. This results from increased EC levels (grey lines) during the morning in the lhy/cca1/gi mutant. (C, D) qRT–PCR measurements of TOC1 and LUX expression in lhy/cca1/gi and lhy/cca1 mutants under 12L:12D. Data are double-plotted to facilitate comparison to simulations.

