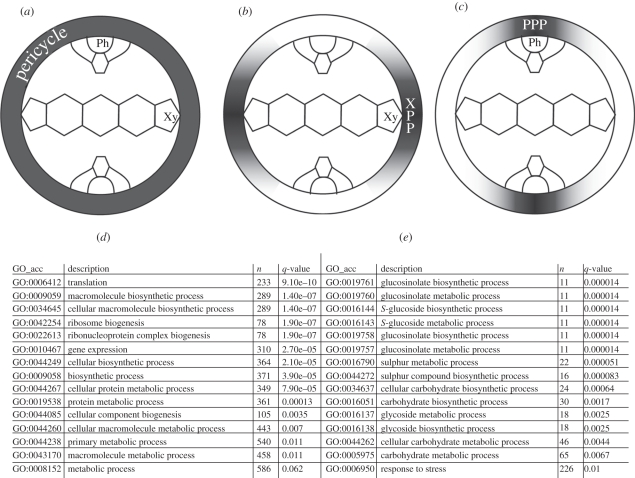
Figure 1.
Pericycle cell populations. Expression profiles of the marker lines used for the microarray experiments and the pairwise comparisons: (a) entire pericycle (XPP + PPP), (b) xylem pole pericycle (XPP) and (c) phloem pole pericycle (PPP). Gene ontology enrichment analysis for the genes significantly upregulated in the (d) XPP and (e) PPP. The symbolized vascular tissues are xylem (Xy) and phloem (Ph).

