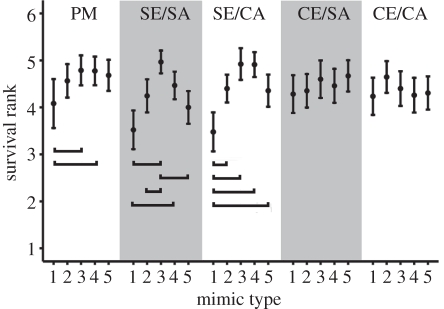
Figure 3.
Mean survival ranks of the mimics in the generalization test. Mimic type 1 denotes the thinnest cross, 2 the second thinnest cross, 3 the perfect mimic, 4 the second boldest cross and 5 denotes the boldest cross. Brackets denote Friedman's pairwise comparisons that are significant at the 0.05 level. Results are shown for each treatment as mean ± s.e.m.; n = 18 in ‘simple edible/simple aposematic’ (SE/SA) and ‘simple edible/complex aposematic’ (SE/CA), 17 in the other treatments. PM, ‘perfect mimicry’; CE/SA, ‘complex edible/simple aposematic’; CE/CA, ‘complex edible/complex aposematic’.

