
FIG 3. Effect of virus source on neutralization phenotype to the first generation broadly neutralizing monoclonal antibodies.
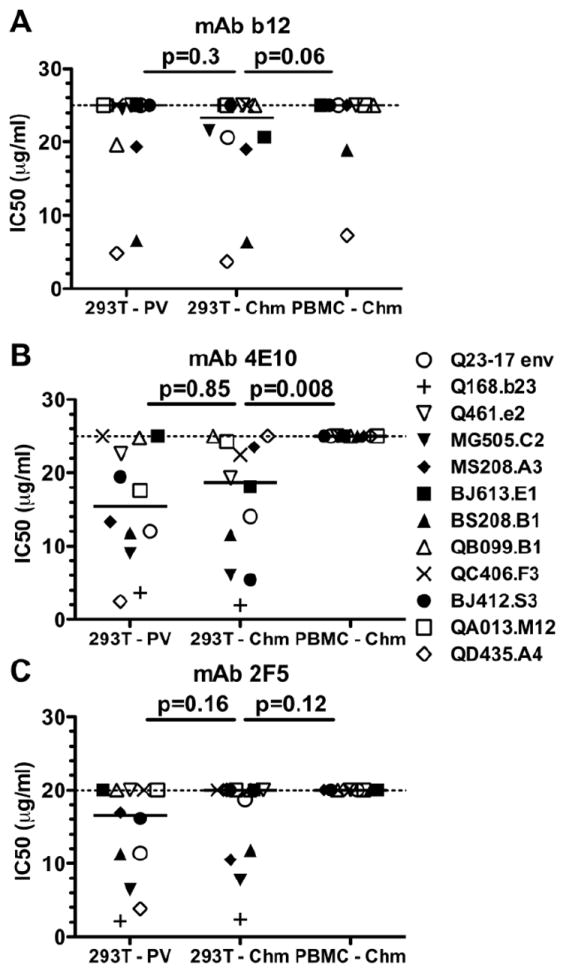
The layout for this figure is as described in the legend to Figure 2, with results for different monoclonal antibodies shown for each panel. (A) Viruses tested against the CD4 binding site directed MAb IgG1 b12 (Burton et al., 1994). (B) Viruses tested against the gp41 directed MAb 4E10 (Zwick et al., 2001). (C) Viruses tested against the gp41 directed MAb 2F5 (Muster et al., 1993). Each symbol represents the mean IC50 of the virus indicated by the envelope it contains to the right, calculated from a minimum of two experiments, performed in triplicate.