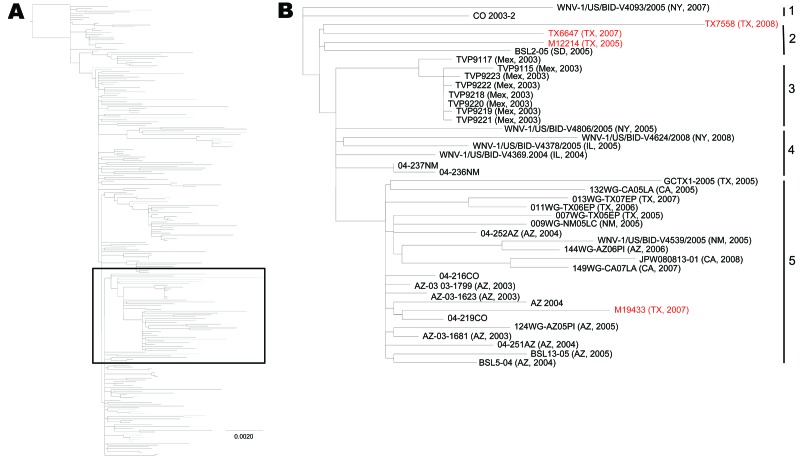
Figure 2.
Maximum-likelihood phylogenetic tree showing all published, full open reading frame North American West Nile virus isolates, 2002–2009 (A), and enlargement showing SW/WN03 genotype (B). Red, isolates sequenced in this study. Scale bar in panel A indicates nucleotide substitutions per site. Numbers on the right in panel B indicate groups.

