
Figure 4.
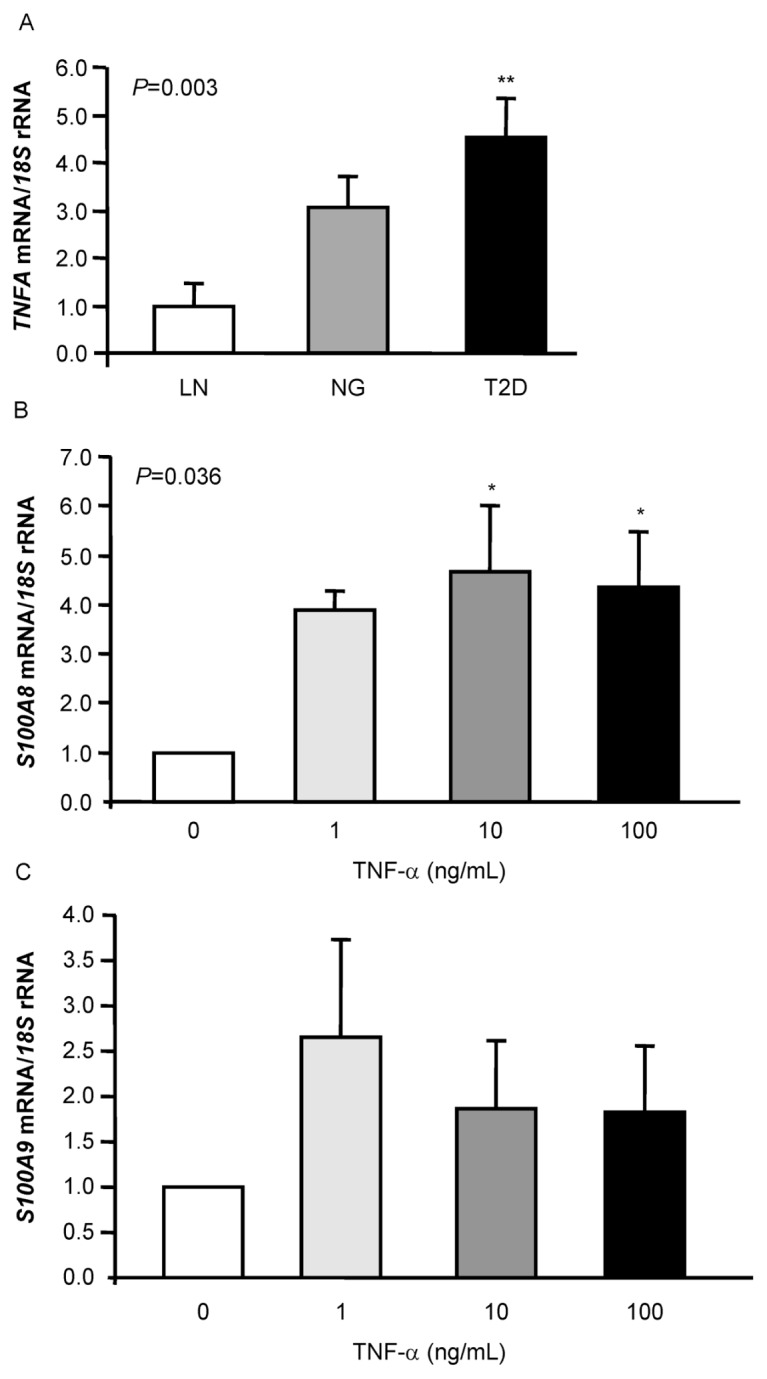
Effect of TNF-α on the expression of both calprotectin subunits S100A8 and S100A9 in human omental adipocytes. Gene expression levels of TNFA (A) in VAT of LN, obese NG and obese T2D volunteers. Bars represent the mean ± SEM of the ratio between the gene expression to 18S rRNA. The expression level in LN subjects was assumed to be 1 (LN: n = 9; NG: n = 10; T2D: n = 10). Differences between groups were analyzed by one-way ANOVA followed by Tukey tests. **P < 0.01 versus LN. Bar graphs show the effect of coincubation for 24 h of TNF-α with omental adipocytes on the transcript levels of S100A8 (B) and S100A9 (C). The gene expression levels in unstimulated cells was assumed to be 1. Values are the mean ± SEM (n = 6 per group). Differences between groups were analyzed by one-way ANOVA followed by Tukey tests. *P < 0.05 versus unstimulated cells.