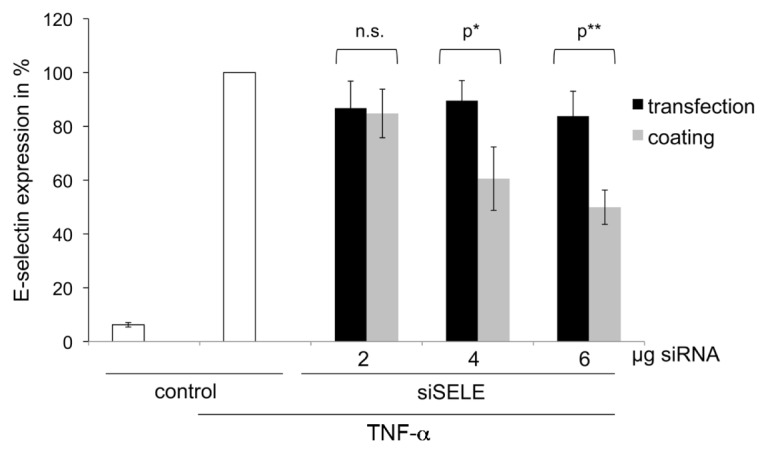
Figure 3.

Comparison of the transfection efficiency between PEI-siRNA complexes with gelatin dried (coating) or as mixture given to detached cells (transfection). The y axis reflects the E-selectin receptor expression in %; untreated cells stimulated with TNF-α were set to 100%. Each bar represents the mean ± SD of n = 3. n.s. indicates not significant, p* indicates statistical significance at a level of P < 0.05; p** indicates statistical significance at a level of P < 0.01.
