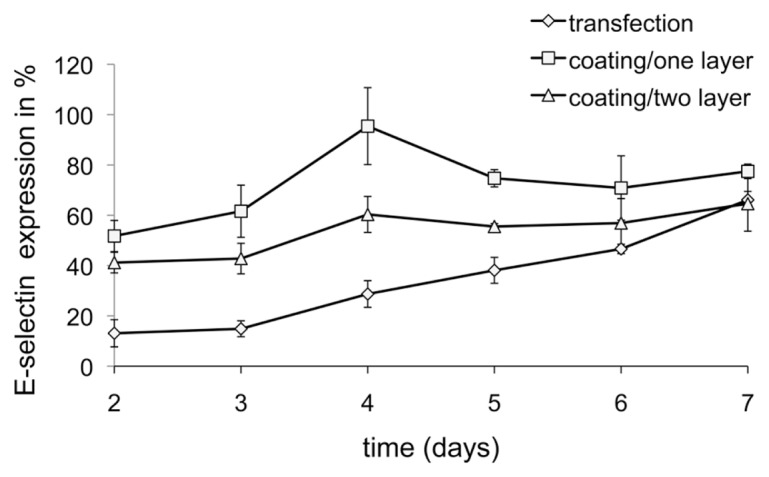
Figure 6.

Duration of siRNA delivery. The x axis reflects the time of analysis of E-selectin expression after cultivation on coatings of one or two layers, with 14 μg siRNA at N/P 3. The y axis reflects E-selectin receptor expression in %, whereby untreated cells stimulated with TNF-α were set to 100%. Mean ± SDs of three independent experiments are shown.
