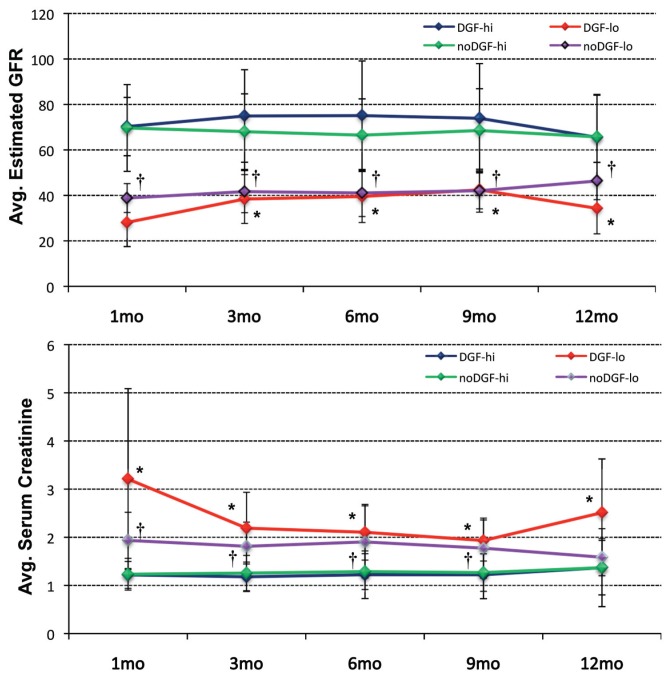
Figure 2.
Course of eGFR (top) and serum creatinine levels (bottom) for the four sub-groups of DGFhi, DGFlo, noDGFhi and noDGFlo during the first year after transplantation. Statistically significant difference (P ≤ 0.05) between the DGF and noDGF ≤45 mL/min group with its corresponding >45 mL/min counterpart are indicated by * (for DGF) or † (for noDGF). Statistical differences were identified by analysis of variance followed by Tukey-Kramer honestly significant difference (HSD) testing (α = 0.05).

