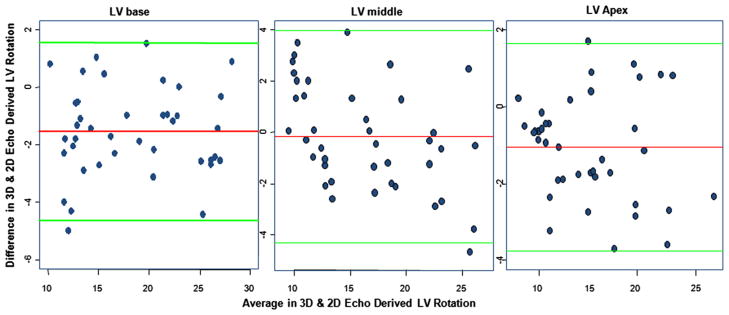
Figure 6.
Bland-Altman plots constructed to explore the agreement between 3D and 2D echocardiographic methods of computing LV rotation with respect to each location (base, middle, and apex). The vertical line (y axis) of each plot is the difference of rotation values obtained between the 3D and 2D methods, and the horizontal line (x axis) is the average of rotation values obtained by the 3D and 2D methods. Almost all data points are within the confidence limits, and <5% of these data points fall outside these boundaries. Such a low rate of falling outside the range limits is acceptable in this kind of analysis.

