Figure 1.

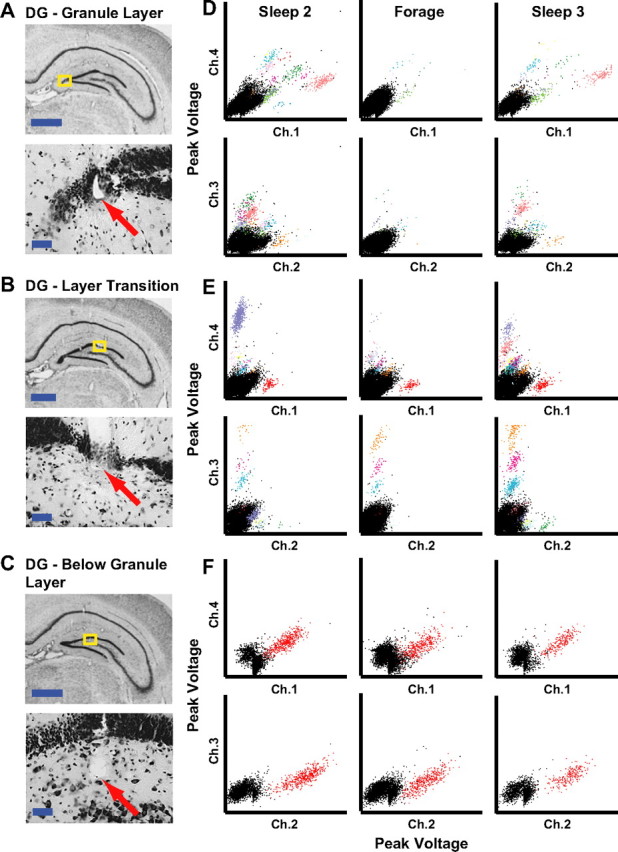
Examples of DG recordings. A–C, Histology from rat 153 showing tetrodes targeting the DG subfield of the hippocampus localized to the granule cell layer (A), a region near the transition between the granule cell layer and hilus (B), and below the granule cell layer (C). The regions of interest (yellow boxes) are magnified to show the tips of the tracks (arrows). Scale bars: 1 mm (top) and 50 μm (bottom). D–F, Scatter plots showing the maximum height of triggered action potentials on two channels of a tetrode during two sleep sessions and a foraging session that each lasted 30 min. The data plotted in D–F were recorded on the tetrodes shown in A–C, respectively. To show the peak voltage on every channel for all spikes, two pairwise comparisons were plotted (top, channel 1 vs 4; bottom, channel 2 vs 3). Each cluster of colored points was considered well isolated (see Materials and Methods).
