Figure 2.
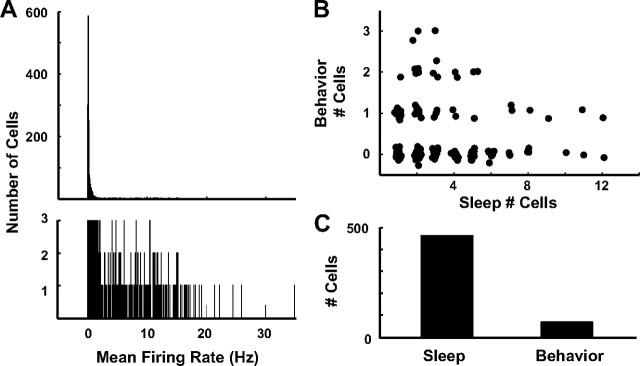
Proportions of DG cells that fire during sleep and behavior suggest two populations of neurons. A, Histogram of the mean firing rates during sleep for all cells detected on tetrodes localized to the DG of seven rats (top). The bottom graph magnifies the bins showing the cell counts ranging from 1 to 3 to visualize the range of firing rate bins (0.05–35 Hz). B, Scatter plot of the number of cells active during behavior versus the number of cells detected during sleep. To aid in visualization of the overlapping data points, jitter was added to the points. C, Summary of data in B showing the number of cells firing during sleep and behavior.

