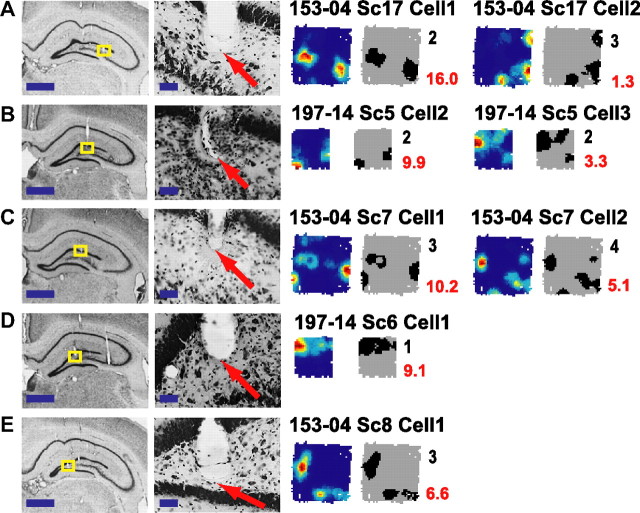
Figure 3.
A–E, Spatial firing rate maps of cells below the granule layer. Rate maps and place-field plots of cells that were localized to the transition between the hilus and zone 3 of Amaral (A–B) and to the hilus (C–E) based on histological reconstruction of tetrode tracks. For the rate maps, blue represents no firing and red represents peak firing, which is labeled in red to the right of the field plots. In the field plots, black represents the regions that were included in each spatially selective subfield. The number of fields is labeled in black to the right of the field plot. Each region of interest (yellow box; left column) is magnified and shows the tip of the tetrode tracks (arrows; right column). Scale bars: 1 mm (right) and 50 μm (left). All of these examples were recorded on tetrodes that were not adjusted between the time of recordings and the perfusion of the animal.

