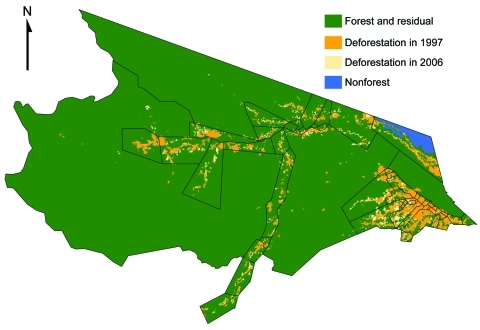
Figure 2.
Deforestation trends in Mâncio Lima, Brazil, based on PRODES (Programa de Cálculo do Desflorestamento da Amazônia) 60 × 60–meter classified satellite imagery. The health districts are outlined in black. Baseline deforestation that occurred in 1997 is orange, deforestation that occurred between 1997 and 2006 is light brown, nonforested land is blue, and forested land is green.

