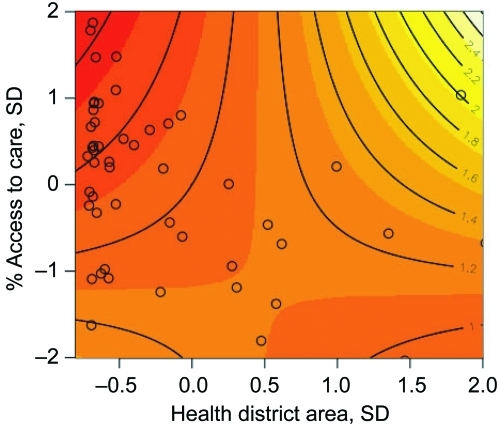
Figure 5.
Joint relative risk plot of access to care and health district spatial area, Mâncio Lima, Brazil. Contour lines indicate the joint relative risk for standard deviation changes in percentage access to care and health district spatial area. Open circles are the observed percentage access to care and health district spatial area size data pairs for the 54 health districts. The contour line increment of relative risk is 0.2, increasing with the shading from red to white.

