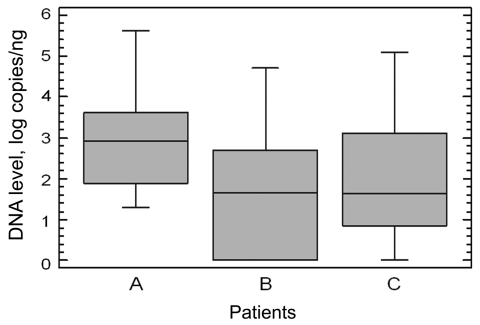
Figure.
Comparison of Merkel cell polyomavirus DNA levels in cutaneous swabs obtained from 46 study participants. A) Patients with Merkel cell carcinoma; B) patients with other skin diseases; C) clinically healthy volunteers. Data are presented as box and whiskers plots. Boxes represent the interquartile range, lines within the boxes represent the median value, and whiskers represent 1.5 × the interquartile range.

