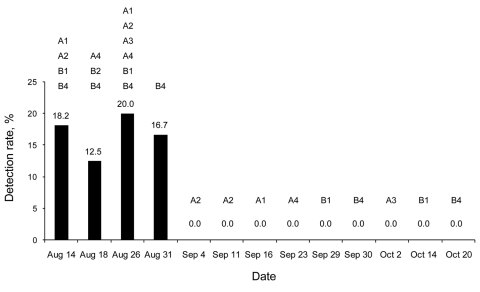
Figure 2.
Pandemic (H1N1) 2009 virus detection rates (%) in affected turkey flocks from farms A and B during August 14–October 20, 2009, Valparaiso, Chile. Tracheal and cloacal swabs were analyzed by real-time reverse transcription–PCR to detect matrix and N1 genes. In each sampling date, detection rates appear in numbers, and sampled flocks are indicated by letters and numbers.

