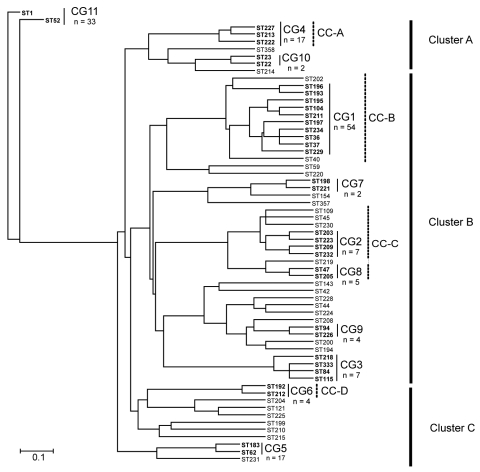
Figure 2.
Dendrogram created by the unweighted pair group method with arithmetic mean method based on the 62 allelic profiles of 194 Legionella pneumophila serogroup 1 isolates. Clonal groups (CGs) identified by eBURST (http://eBURST.mlst.net) are indicated with solid lines, and STs included in CGs are in boldface. Ontario STs included in clonal complexes (CC) identified by comparative eBURST analysis with the European Working Group for Legionella Infections database are indicated with dashed lines. The 3 major clusters are indicated on the right of the figure with bold lines. The number of strains isolated in Ontario is indicated below CG. Scale bar indicates linkage distances.

