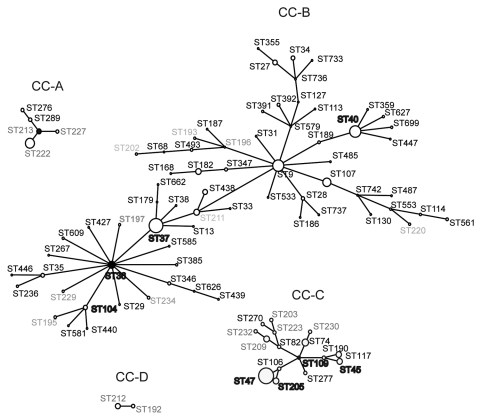
Figure 3.
Representation of Legionella pneumophila serogroup 1 clonal complexes (CC) A, B, C, D obtained by comparative eBURST (http://eBURST.mlst.net) analysis between the Ontario collection and the European Working Group for Legionella Infections database. Each circle represents a single sequence type (ST). Size of the circle is proportional to the number of isolates. Dark circles represent predicted founder of each CC. Labels in boldface indicate STs found in both datasets, regular black characters indicate STs absent from the Ontario collection, light gray characters indicate STs exclusively found in Ontario. Solid lines represent single-locus variants.

