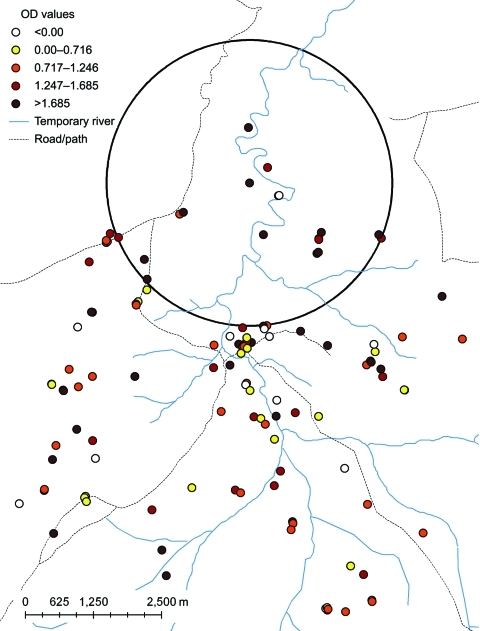
Figure 2.
Age-adjusted optical density (OD) values for antibodies against Plasmodium falciparum in the study population, Ceel-Bardaale, Somalia, 2008. Colored dots indicate mean age-adjusted optical densities per household for combined seroreactivity to P. falciparum merozoite surface protein 119 and apical membrane antigen 1. The large circle indicates a statistically significant cluster of higher P. falciparum seroreactivity that was detected by a spatial scan on the age-adjusted seroreactivity of individual study participants to both P. falciparum antigens (p = 0.002). As a result of age adjustment, some persons had lower than expected seroreactivities. This adjustment resulted in negative OD values.

