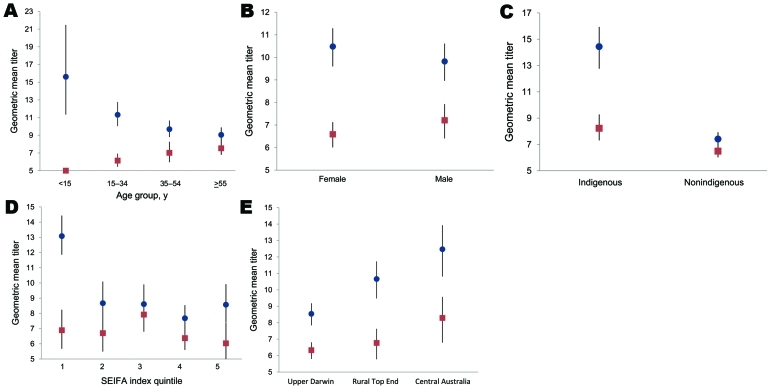
Figure 2.
Unadjusted geometric mean antibody titers by age group (A), sex (B), indigenous status (C), SEIFA index (D), and study region (E) in a study of differential effects of pandemic (H1N1) 2009 on remote and indigenous groups, Northern Territory, Australia, September 2009. Red, prepandemic titer; blue, postpandemic titer. Bars indicate range. SEIFA, Australian Bureau of Statistics’ Socio-Economic Indexs for Area.

